Atmospheric Composition by Satellite Remote Sensing
For the final project of my CHEM 313 class (Quantitative Data Analysis for Chemists, Fall 2020), students were to create a data visualization from satellite data to answer a self-written research question.
After preliminary exploration, I determined that I wanted to explore the impact of pandemic lockdowns on air pollution in major cities across the globe:
To what extent has there been a quantifiable decrease in atmospheric NO2 (which is contributed to by automotive emissions) levels in urban centers due to recent COVID-19 related lockdown orders when compared to similar times of past years?
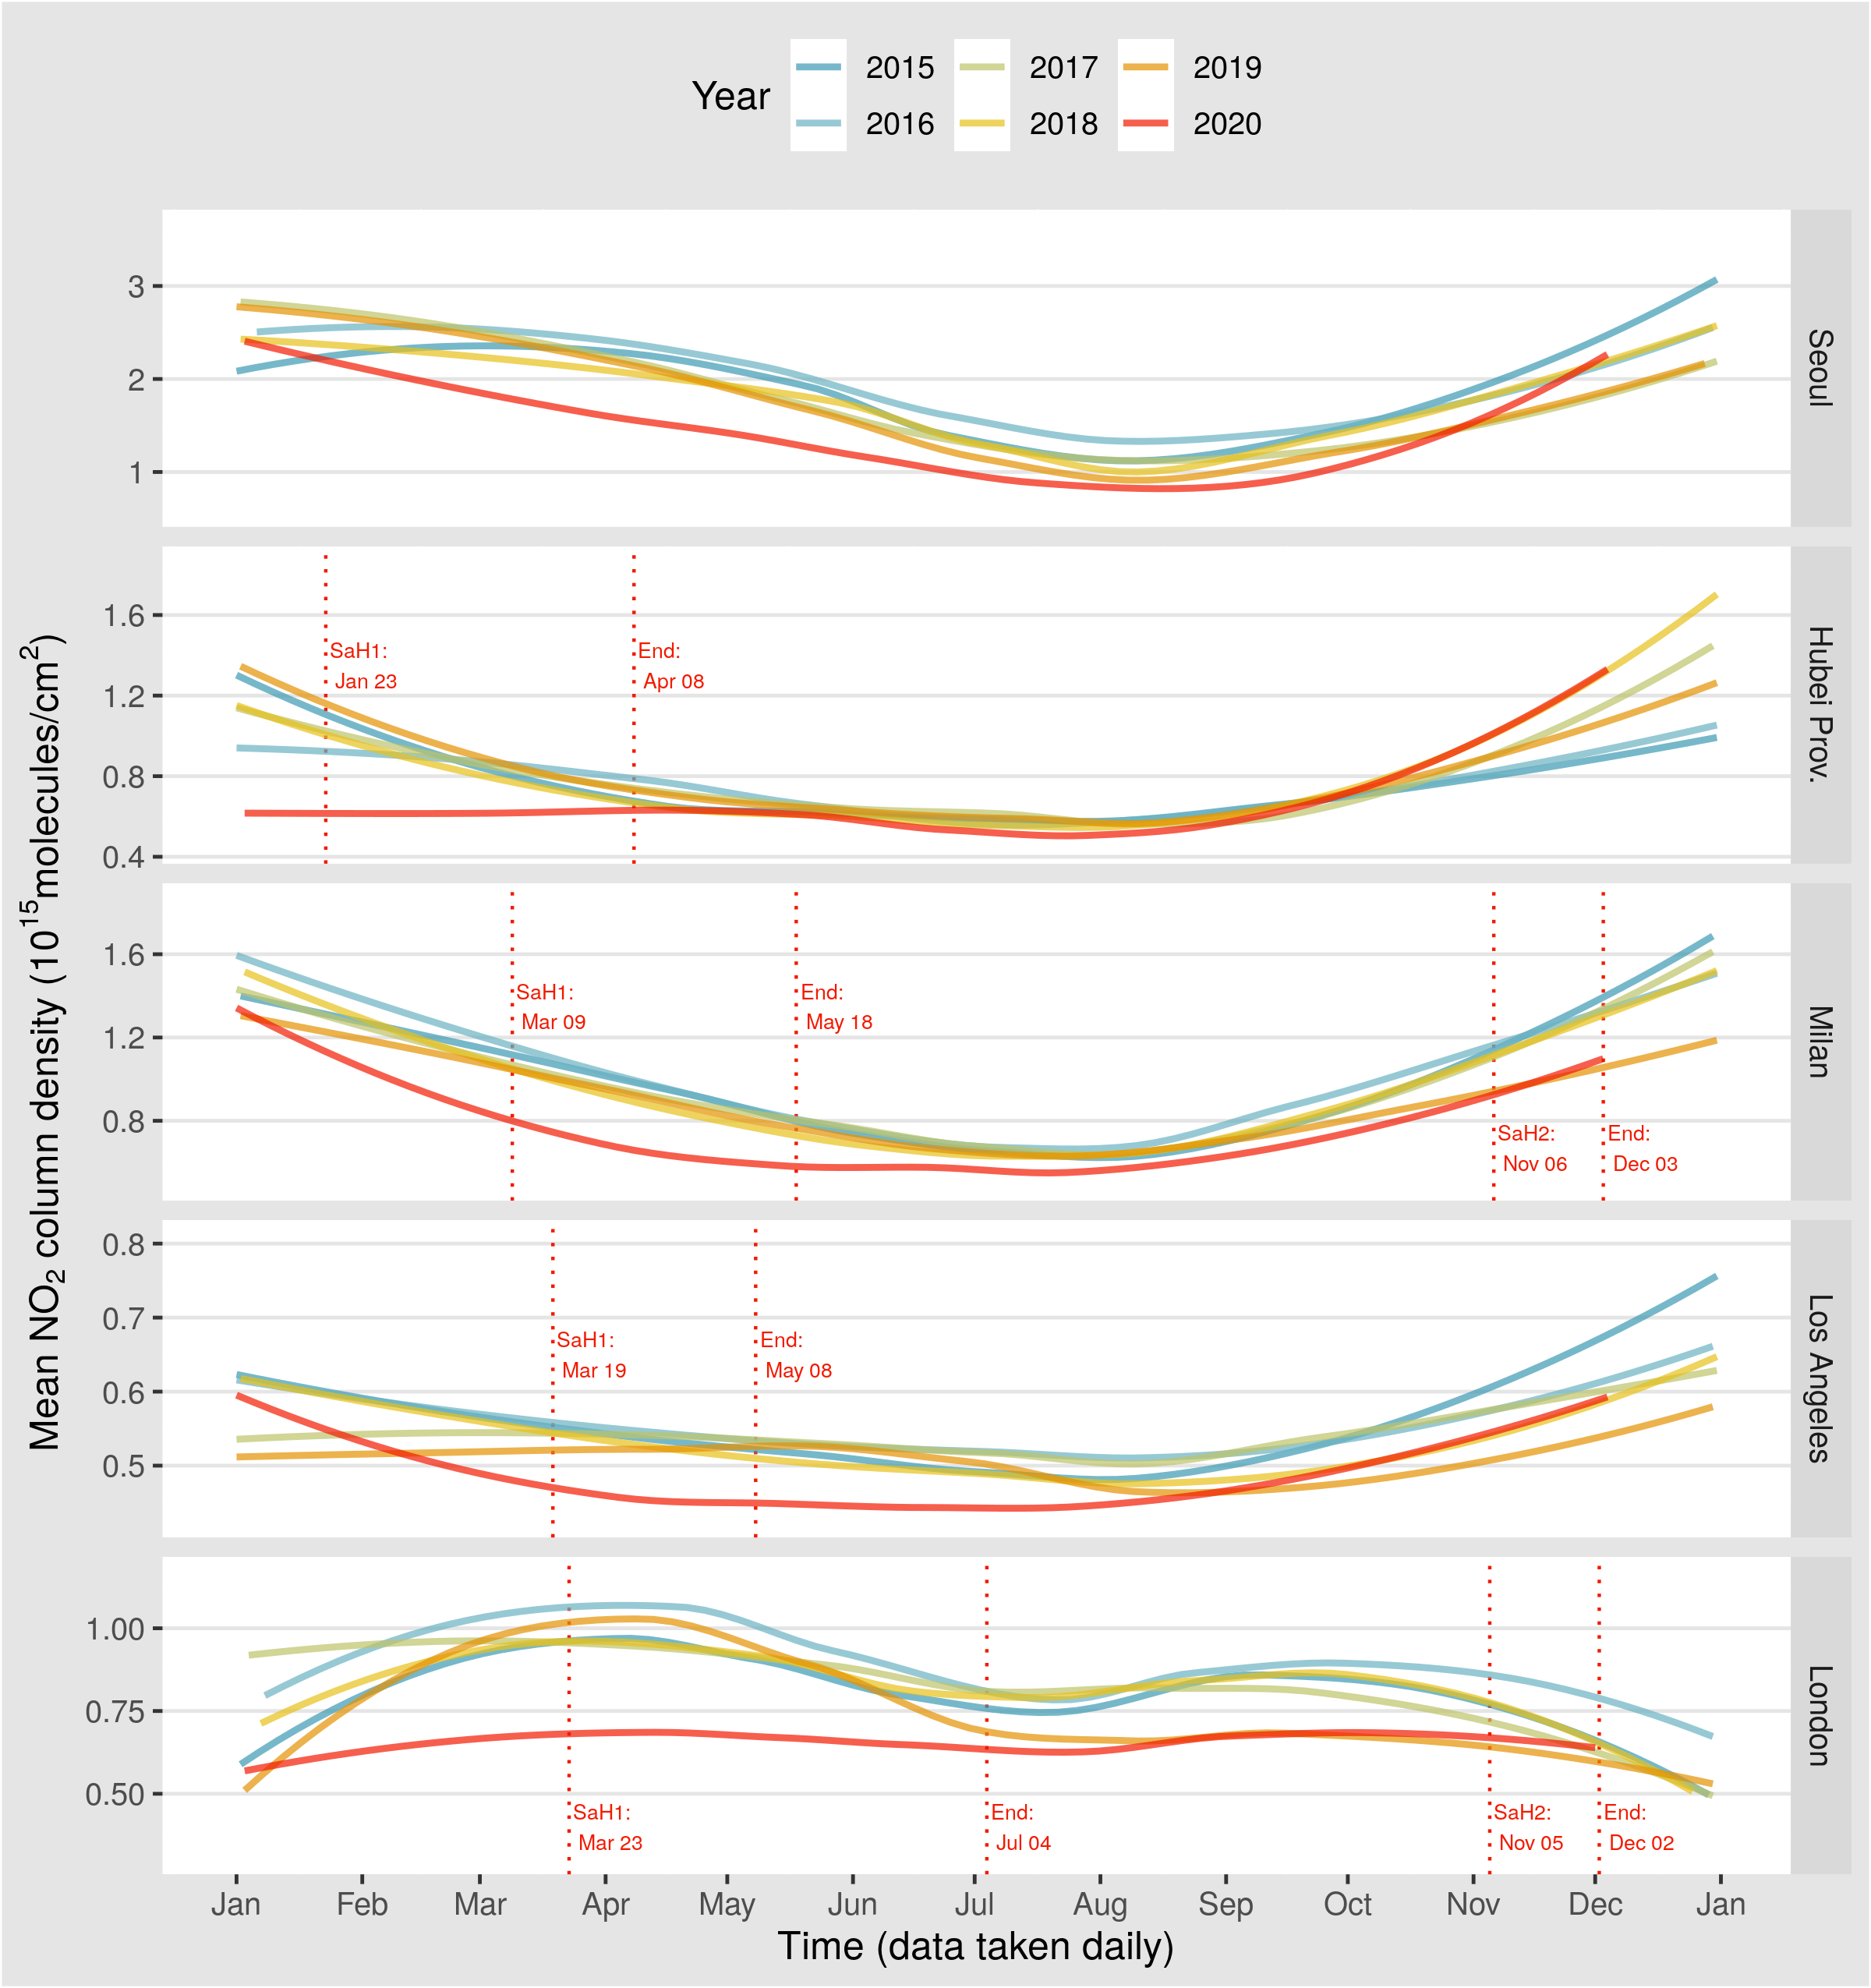
Figure: Loess regression lines fitted to daily mean NO2 column density (1015 molecules/cm2) over time by year (2015 through 2020) in five urban centers (Seoul, South Korea; Hubei province, China; Milan, Italy; Los Angeles, California, USA; and London, England, UK) and their surrounding areas, with markers for 2020 stay-at-home (“SaH”) start and end dates where applicable. Lockdown end date for the province of Hubei based on that for the city of Wuhan. Data from NASA Aura OMI from 01 Jan 2015 to 04 Dec 2020, with negative values excluded.
Based on visual analysis of the data, there is a noticeable decrease in atmospheric NO2 levels in urban centers since the start of 2020 and during times of lockdown. These decreased levels appear before stay-at-home orders were implemented in many of the cities. Even Seoul, which did not undergo lockdown, experienced a decrease in these levels when compared to trends of previous years. However, post-lockdown trends generally show a (slow) return to the trends of previous years. Secondary lockdowns (which occurred in Milan and London) do not appear to have an impact on levels when compared to 2019 data. For further analysis, it would be beneficial to conduct statistical tests to determine if the 2020 data differs in a statistically significant way, and to analyze data from other megacities or urban centers which had a high percentage of auto commuters pre-2020.
The full data set, wrangling code, and visualization code can be found on my project’s GitHub repository here.
Data was downloaded from NASA Giovanni, accessed 06 December 2020. Final data created with NO2 Total Column (30% Colud Screened) data (OMI; temporal resuoltion = daily; spatial resolution = 0.25°).
More information on OMI NO2 measurements can be found here
More information on Giovanni NO2 parameter can be found here.
Selected cities were partly inspired by a March 2020 article analyzing a drop in air pollution as a result of pandemic lockdowns.
The dates of COVID-19 pandemic lockdowns (as of December 2020) were taken from Wikipedia.